DynamoDB On-Demand does not mean unlimited: the four limits that still throttle you
On-Demand looks like infinite scale until it throttles. The initial 4,000 WCU ceiling, the 2× previous peak rule, the 40,000 table quota, and the per-partition limit you cannot raise at any price.
- AWS
- Serverless
- DynamoDB
- Scaling
DynamoDB supports On-Demand capacity. So enabling On-Demand means the table scales to whatever you throw at it, right?
Maybe. Usually. Not always — and the exceptions are specific enough to design around, which is the entire point of this post.
On-Demand removes the job of guessing your capacity. It does not remove capacity limits. There are four of them stacked on top of each other, and they fail in different ways at different scales. One of them cannot be raised by any support ticket, at any price, ever.
Limit 1: the initial ceiling on a new table
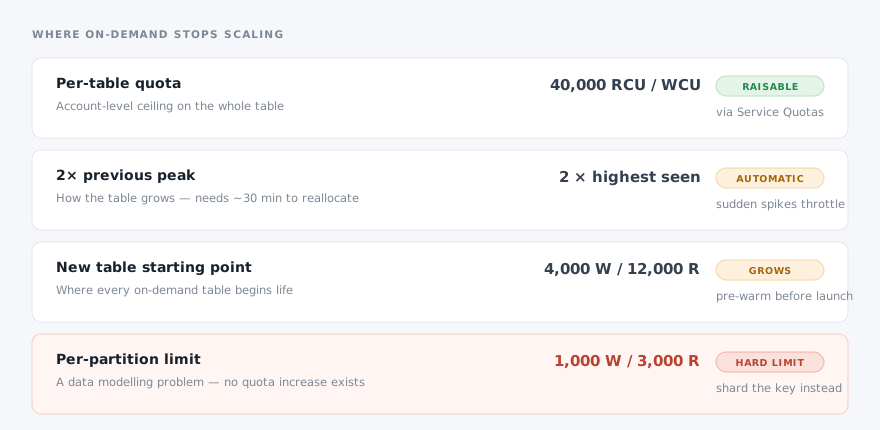
A newly created On-Demand table does not start at infinity. It starts able to serve roughly 4,000 WCU and 12,000 RCU, shared across the table's partitions.
For most workloads that is plenty and you will never think about it. But if your first real event is a migration backfill, a bulk import or a launch spike, your table's very first experience of load is also its least capable moment. Plenty of people have concluded DynamoDB "can't handle" a bulk load when what actually happened is that they hit the starting line at full speed.
Limit 2: the 2× previous peak rule
This is the mechanism that makes On-Demand feel elastic, and it is the one most worth internalising.
DynamoDB allocates capacity based on the highest traffic the table has previously handled. It will accommodate up to double your previous peak. Hit 9,000 RCU once and the table is subsequently prepared for 18,000. Hit 18,000 and it prepares for 36,000. The table ratchets upward as it learns what you need.
The catch is in the timing:
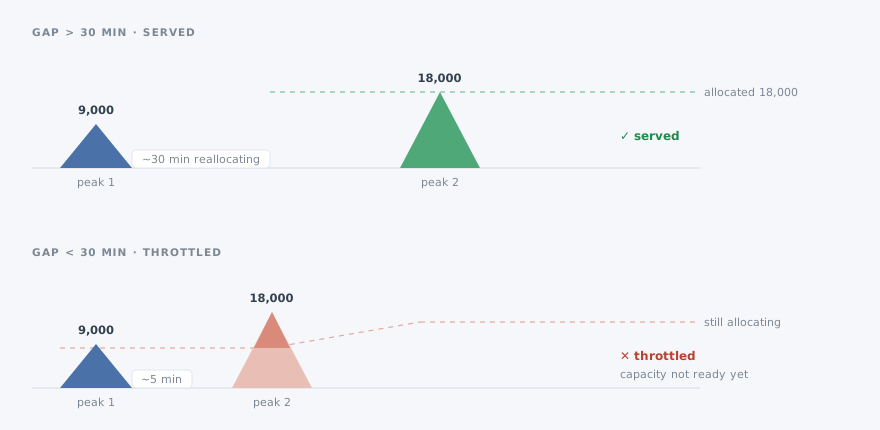
DynamoDB needs roughly 30 minutes to finish reallocating. If your next peak arrives before that window closes, the capacity is still being provisioned and you get throttled while it catches up.
This is why traffic patterns matter as much as traffic volume. A workload that doubles every hour scales beautifully. A workload that sits idle and then goes from 500 to 20,000 RCU in ninety seconds — a cron job, a cache flush, a marketing email hitting inboxes — throttles, even though DynamoDB would happily serve that volume steadily.
The failure is not "too much traffic". It is "too much traffic, too suddenly, relative to what this table has seen before."
Limit 3: the table-level quota
Above the per-table adaptive behaviour sits an account quota: by default around 40,000 read and 40,000 write capacity units per table. Exceed it and requests throttle regardless of how gracefully you ramped up to it.
This one is a soft limit. Raise it through AWS Service Quotas — and do it before the launch, not during it, because quota increases are not instant. If you know you are going to need 80,000 WCU on Black Friday, that request belongs in your launch checklist weeks ahead.
Limit 4: the per-partition limit you cannot raise
Here is the one that catches good engineers.
Every individual partition is capped at 3,000 RCU and 1,000 WCU. That is a hard limit. There is no Service Quotas form. There is no enterprise support tier that lifts it. If a single partition key receives more than 1,000 writes per second, those writes throttle — while the rest of your table sits almost idle and your CloudWatch consumed-capacity graph looks completely healthy.
That last detail is what makes it so confusing to debug. Table-level metrics average across partitions, so a table doing 2,000 WCU total with 1,400 of them landing on one key looks fine in aggregate and throttles in production.
This is a data modelling problem, not a capacity problem, and no amount of On-Demand fixes it. Your partition key choice determines whether load spreads or piles up.
Classic ways to build a hot partition without noticing:
- A status field as the partition key —
PK = "ORDER#PENDING"puts every pending order on one partition. - Today's date as the partition key — every write all day lands on one key, and tomorrow it moves to the next one.
- A tenant ID in a multi-tenant system — works fine until one customer is 40× larger than the others.
- A sequential ID — monotonically increasing keys concentrate writes at the end of the keyspace.
Sharding a hot partition
The fix is to spread one logical key across several physical ones by appending a shard suffix:
const SHARD_COUNT = 10;

// Write: pick a shard. Random spreads evenly; hashing an attribute keeps
// related items together and makes the shard reproducible on read.
const shard = Math.floor(Math.random() * SHARD_COUNT);
await ddb.put({
  TableName: "orders",
  Item: { PK: `ORDER#PENDING#${shard}`, SK: orderId, ...order },
});

// Read: you now have to query every shard and merge.
const results = await Promise.all(
  Array.from({ length: SHARD_COUNT }, (_, i) =>
    ddb.query({
      TableName: "orders",
      KeyConditionExpression: "PK = :pk",
      ExpressionAttributeValues: { ":pk": `ORDER#PENDING#${i}` },
    }),
  ),
);
Ten shards turn a 1,000 WCU ceiling into 10,000. The cost is that every read becomes a scatter-gather across ten queries, which you then merge and sort in your application. Choose SHARD_COUNT deliberately: too few and you are still throttled, too many and every read pays for shards that hold almost nothing.
Use random suffixes when you only ever read the whole set. Use a hash of some attribute when you need to find a specific item again without querying all shards.
The fifth thing: GSI backpressure
Not a numbered limit, but it produces the most baffling incidents, so it earns its own section.
Every write to a base table that touches a GSI's projected attributes also writes to that index. If the GSI's partitions throttle, that backpressure propagates to the base table — writes to the base table start failing because the index cannot keep up.
So you can have a perfectly well-distributed base table and still throttle, because a GSI you added six months ago for one admin screen uses status as its partition key and is now the bottleneck for your entire write path.
When you are debugging write throttles, check the throttle metrics on every GSI before you touch the base table's design. And apply the same partition-key discipline to indexes that you apply to tables — a GSI is a table, with all the same physics.
Designing so none of this bites
1. Spend most of your time on access patterns, before you create the table. This is the whole game. DynamoDB rewards knowing your queries in advance and punishes discovering them later. The partition key decides whether your load spreads evenly or piles into one hot spot, and changing it afterwards means a migration.
2. Shard keys you can predict will be hot. If a key represents a status, a date, a tenant or a queue, assume it will be hot and design the shard in from the start. Retrofitting sharding is far more painful than starting with it.
3. Pre-warm before planned spikes. If you know a spike is coming, drive synthetic traffic beforehand to raise the previous-peak baseline, and leave more than 30 minutes before the real event. AWS now also offers Warm Throughput, which lets you set a higher baseline explicitly rather than faking it with load — it costs money, priced on the gap between the throughput you want and the table's current warm value, but it is far more predictable than a homemade warm-up script.
4. Alarm on throttles, and on the right metric.
ThrottledRequests and ReadThrottleEvents / WriteThrottleEvents on both the table and every GSI. Throttles are not a capacity signal you can infer from consumed capacity — as we saw, a hot partition throttles while the table average looks fine. You have to watch the throttle metrics directly.
The short version
On-Demand means you stop guessing capacity. It does not mean the table has none.
- 4,000 WCU / 12,000 RCU — where a brand-new table starts.
- 2× previous peak — how it grows, with a ~30 minute reallocation window.
- 40,000 per table — the account quota; raisable, but ask early.
- 1,000 WCU / 3,000 RCU per partition — the hard one. No ticket lifts it.
The first three are operational problems with operational answers. The fourth is a design problem, and by the time it hurts, the design is already in production.
Which is the real argument for spending an unreasonable amount of time on access patterns before you create the table.