The nine cents that worried me: SQS empty receives, short polling and 135K wasted requests a day
A 430% AWS bill jump had an obvious culprit and an interesting one. The interesting one was nine cents of SQS charges from queues serving almost no messages. How SQS request pricing works, the metric that exposes it, and the two fixes.
- AWS
- Serverless
- Cost optimisation
- SQS
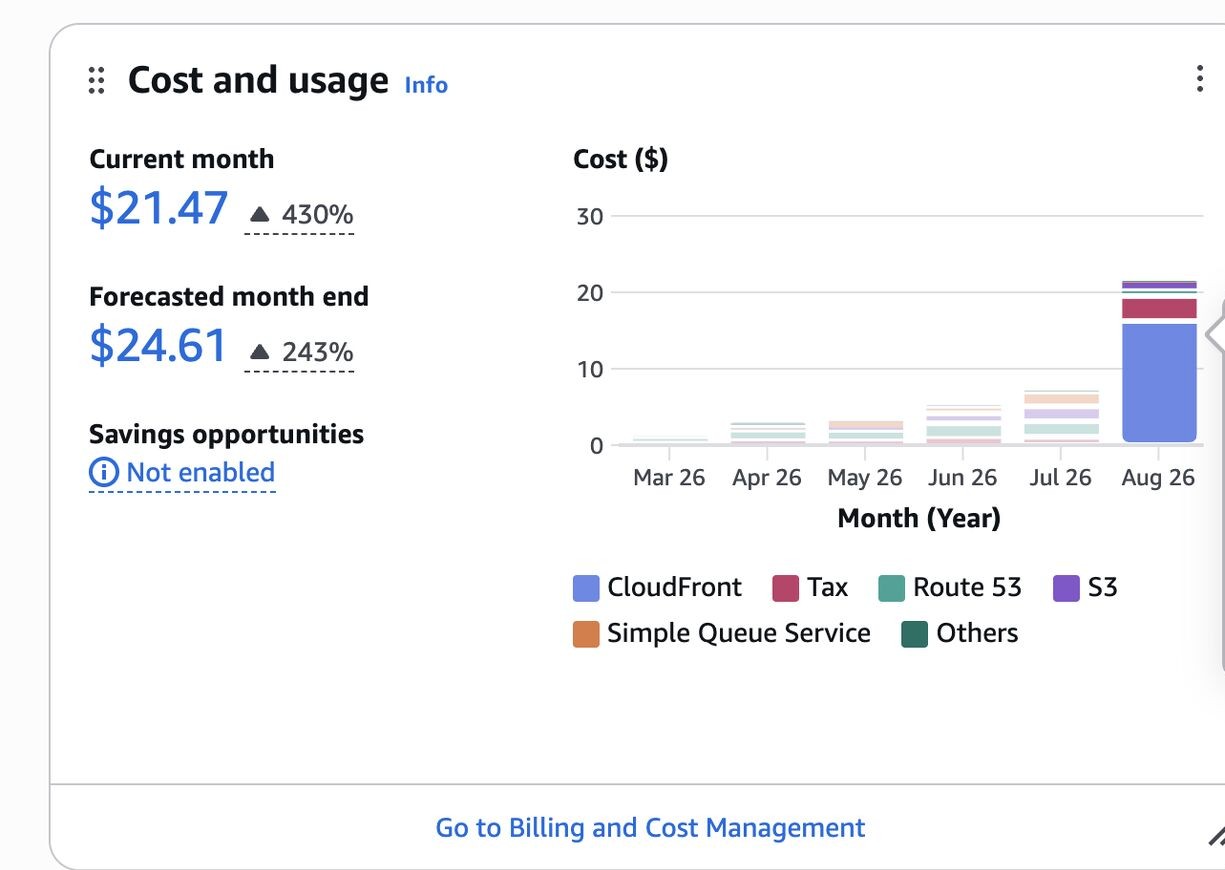
I woke up to a 430% jump in my AWS bill.
Most of it was CloudFront — $16.24 of a $21.47 month, caused by a cache invalidation loop I had written badly a long time ago and never revisited. That one is a straightforward story with a straightforward fix, and it deserves its own post another day.
The line that actually held my attention was the one at the bottom.
Simple Queue Service: $0.09.
Nine cents. Statistically irrelevant to that bill. I nearly scrolled past it — and then realised I could not explain why it was there at all. Those queues were serving almost no messages that month. The features behind them were barely used. The number should have been zero.
It was not zero because my queues had spent the entire month asking "any messages?" roughly 135,000 times a day and being told "no" almost every time.
Every one of those questions is a billable request.
That is why nine cents was worth an afternoon. Not because of the nine cents — because of what it implied about the shape of the system. A cost that appears when you are doing nothing does not stay small when you start doing something. It scales with the number of queues and the passage of time, neither of which correlates with how much value the system is producing.
This is the failure mode serverless is worst at warning you about. Nothing broke. No alarm fired. No log line said anything was wrong. The architecture was working — it was just working in a shape that costs money in proportion to how often it does nothing.
Why serverless costs surprise you specifically
Traditional infrastructure fails loudly and bills predictably. You provision a box, you pay for the box, and when the box is too small things get slow in ways you notice.
Serverless inverts both halves. It absorbs load silently, and it bills per operation. Which means the thing that grows your bill is often not traffic — it is configuration that was fine when the project was small. A polling interval, a batch size, a retry policy. Numbers that were invisible at three queues become line items at fifteen.
And there is a newer wrinkle: when you generate a lot of your infrastructure code with AI, you get defaults. Defaults are chosen to work everywhere, not to be cheap in your case. ReceiveMessageWaitTimeSeconds defaults to 0. Nothing will ever tell you that is expensive.
How SQS actually charges you
This is the part most people have never sat down and read, so it is worth being precise.
SQS bills per API request, not per message. In most regions that is roughly $0.40 per million requests for standard queues (FIFO is higher), with the first 1 million requests per month free. Check the pricing page for your region and current rates before you do your own maths — but the shape is what matters here.
A "request" is any API action: SendMessage, ReceiveMessage, DeleteMessage, ChangeMessageVisibility. And three details do most of the damage:
- A
ReceiveMessagecall that returns nothing still costs a request. This is an empty receive, and it is billed exactly like a productive one. - A
ReceiveMessagecall that returns 10 messages is also one request. Batching is close to free money. - Every message normally costs you at least two requests — one to receive, one to delete — plus the send. A single message end-to-end is three requests minimum.
Point 1 is where the bill came from. Points 2 and 3 are where the fix comes from.
Doing the arithmetic on an idle queue
Here is the trap in numbers. A queue with short polling and a Lambda event source mapping attached will be polled continuously whether or not anything is in it.
At my volume:
135,000 requests/day
÷ 1,000,000 free/month  → free tier gone in ~7 days
That is the real finding. Not the nine cents — the fact that the entire monthly free tier was consumed in about a week by queues doing nothing useful. Everything after day seven, across every queue in the account, including all the legitimate traffic, was billed from request one. The nine cents is just what that happened to add up to in a month where there was barely any legitimate traffic to bill.
Project it forward and the shape becomes clearer:
135,000 requests/day
× 30 days               = 4,050,000 requests/month
− 1,000,000 free        = 3,050,000 billable
× ~$0.40/million        ≈ $1.20/month
Still small. Still, on its own, not worth writing about.
But that is a cost floor for an idle system, and it has two properties that should bother you: it scales with the number of queues, and it does not go down when usage does. Add ten more queues as the product grows and you are paying a growing monthly fee for the privilege of having infrastructure that is not being used. Meanwhile the free tier — which was supposed to absorb your real traffic — has already been spent on empty responses.
The number was small. The shape was wrong, and shape is what scales.
Short polling vs long polling
When you call ReceiveMessage, SQS has two behaviours available.
Short polling (ReceiveMessageWaitTimeSeconds = 0, the default) samples a subset of servers and returns immediately — even with nothing to give you. Your consumer gets an empty response in milliseconds and, being a loop, immediately asks again. An idle queue under short polling generates requests as fast as your consumer can make them.
Long polling (ReceiveMessageWaitTimeSeconds up to 20) holds the connection open until a message arrives or the wait expires. One request now covers up to twenty seconds of silence instead of a few milliseconds.
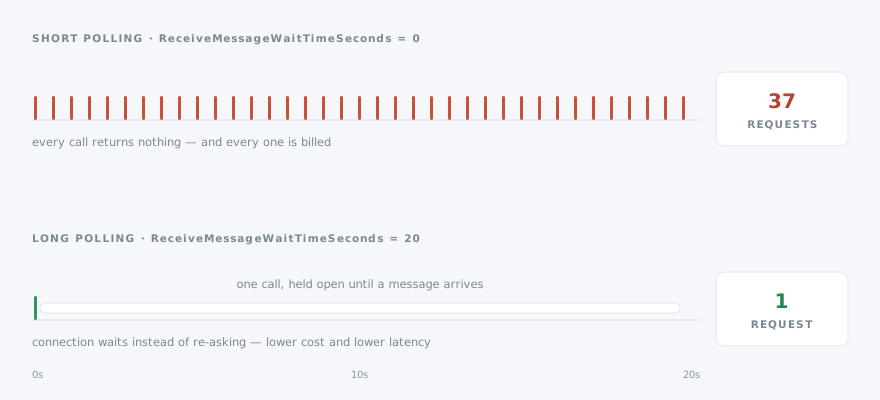
The reduction on an idle queue is dramatic — you are replacing hundreds of empty receives per minute with three. It is also better latency, which is the counterintuitive part: a long-polled consumer gets the message the moment it lands, rather than on its next scheduled poll.
There is essentially no reason to leave a production queue at 0.
ReceiveMessageWaitTimeSeconds: 20
Set it on the queue, not just the client, so every consumer inherits it. In SAM or CloudFormation:
MyQueue:
  Type: AWS::SQS::Queue
  Properties:
    ReceiveMessageWaitTimeSeconds: 20
This applies to Lambda event source mappings too. The ESM polls on your behalf and you never see the calls in your own code — which is precisely why this one hides so well. You did not write the loop, so you do not think to look at it.
The metrics that expose it
You cannot fix what you are not looking at, and the default SQS dashboard does not lead with the number that matters.
NumberOfEmptyReceives is the metric. It counts exactly what it says: receive calls that returned nothing. If it is large and NumberOfMessagesReceived is small, you are paying to ask a question whose answer is always no.
The ratio is the diagnostic:
NumberOfEmptyReceives / NumberOfMessagesReceived
On a healthy, busy queue this is near zero. On the queues that caused this bill it was in the hundreds. Anything above ~10 on a queue you expect to be active deserves a look; on a genuinely low-traffic queue, long polling should still keep it in the low tens rather than the thousands.
Worth watching alongside it:
| Metric | What it tells you |
|---|---|
NumberOfEmptyReceives | Wasted polling — the cost driver |
NumberOfMessagesReceived | Actual useful work |
NumberOfMessagesSent | Whether producers match your expectations |
ApproximateNumberOfMessagesVisible | Backlog depth — is anything even arriving? |
ApproximateAgeOfOldestMessage | Whether consumers are keeping up |
A queue where NumberOfMessagesSent is near zero and NumberOfEmptyReceives is enormous is a queue you are paying to keep warm for no reason. Sometimes the right fix is deleting it.
Finding it in the bill
In Cost Explorer, filter to SQS and group by Usage Type. Request charges show up as a Requests-Tier1-style usage type. Group by Resource if you have that enabled, and the offending queues name themselves.
Then turn on AWS Cost Anomaly Detection with a monitor on your serverless services. It is free, and a 430% jump is exactly the shape it is built to catch. I would rather have been emailed on day two than have found this myself on day thirty.
The second change: fewer queues
Long polling fixed the waste per queue. The other half of the problem was how many queues I had.
I had been creating a queue per domain concept, which reads beautifully in an architecture diagram and means every one of them runs its own poller, on its own schedule, generating its own baseline of requests forever. Fifteen mostly-idle queues cost fifteen times one mostly-idle queue.
So I consolidated related domain queues into a single queue, put an eventType discriminator in the message body, and let one Lambda route on it:
{
  "eventType": "user.subscription.created",
  "payload": { "userId": "…", "planId": "…" }
}
export const handler = async (event: SQSEvent) => {
  for (const record of event.Records) {
    const { eventType, payload } = JSON.parse(record.body);
    switch (eventType) {
      case "user.subscription.created":
        await onSubscriptionCreated(payload);
        break;
      // …
    }
  }
};
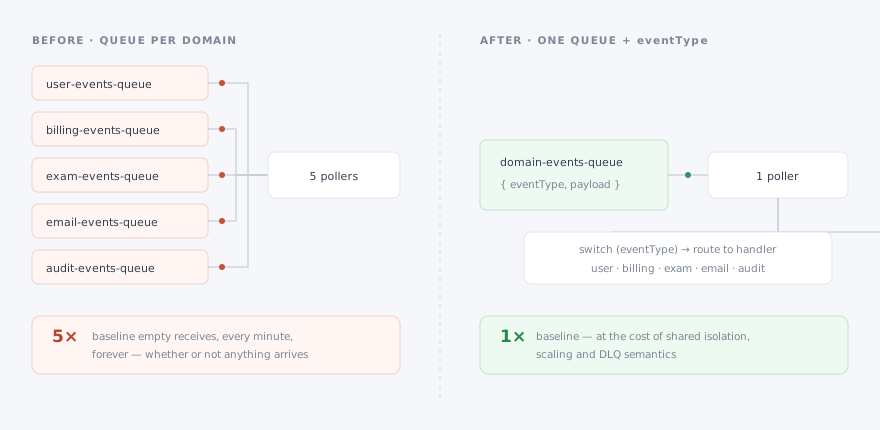
Fewer queues, fewer pollers, fewer baseline requests.
Be honest about the tradeoff
This is not free, and it is not right for every system. Consolidating queues costs you:
- Isolation. One poison message or one slow handler now affects every event type sharing that queue. Head-of-line blocking becomes a real risk.
- Independent scaling. You can no longer tune concurrency, batch size or visibility timeout per event type — they share one event source mapping.
- Clean per-domain metrics and alarms. Queue depth was a per-domain signal; now it is an aggregate, and you have to emit your own metrics per
eventTypeto get it back. - Separate DLQ semantics. One dead-letter queue, mixed failure modes, more work at triage time.
Consolidate queues that share a consumer profile — similar volume, similar latency tolerance, similar failure handling. Keep a queue separate when its traffic shape, criticality or retry policy genuinely differs. A high-volume ingestion path and a once-a-day admin notification do not belong together no matter how tidy it looks.
If isolation matters more than request count, an alternative is keeping the queues and using EventBridge Pipes or SNS fan-out — but understand you are choosing to pay for the separation.
Other places this same bug hides
The pattern — idle infrastructure billed per operation — is not unique to SQS. Once you have seen it, you find it everywhere:
- DynamoDB Streams and Kinesis consumed by Lambda: the ESM polls shards continuously, whether or not records exist. Idle shards still generate calls.
- Step Functions Standard workflows used for high-volume, short-lived work: billed per state transition, which adds up far faster than people expect. Express workflows exist for this.
- CloudWatch Logs at default settings: no retention policy means you pay storage on debug logs forever. Set retention on every log group.
- Lambda
MaximumBatchingWindowInSecondsleft at0: your function is invoked per trickle of messages instead of per batch, multiplying both invocations and downstream calls. - Old Lambda versions and unused queues from deleted features, still deployed, still polled.
The common thread is that none of these are errors. Every one is a working system with a default that was appropriate at a smaller scale.
The checklist I wish I'd had
For every SQS queue in your account:
-
ReceiveMessageWaitTimeSecondsis20, not0 - Consumers receive in batches of up to 10, and delete in batches
-
MaximumBatchingWindowInSecondsis set on the ESM where latency allows -
NumberOfEmptyReceivesis graphed, and alarmed if it drifts - The queue still has a producer — dead queues get deleted
- Cost Anomaly Detection is on for the account
- Log groups have a retention policy
The actual lesson
The fix took twenty minutes. Finding it took a bill — and not even the expensive part of the bill.
That is the bit worth keeping. The $16 of CloudFront charges was the headline, and it was also the easy problem: big, obvious, one bad loop, one clear fix. The nine cents was the one that told me something about how the system was built, because it was a cost with no corresponding work. If I had only chased the big number I would have fixed the bill and left the pattern in place.
Small misconfigurations do not matter when a project is tiny — that is the whole problem. They are invisible at three queues and load-bearing at fifteen, and nothing in between fires an alarm. The cost of a bad default is not the money; it is that the money is the only signal you get, it arrives a month late, and it is usually too small to notice until it isn't.
When you are reading a cost breakdown, the line that should stop you is not the biggest one. It is the one you cannot explain.
So I did not just fix the bill. I wrote the findings back into the serverless checklist I build from, so the next queue starts at 20 without me having to remember why.
If you take one thing from this: go and look at NumberOfEmptyReceives on your busiest account right now. It takes two minutes, and the number is either reassuring or it just paid for your morning.